
Change saturation: who can absorb how much change?
Wetterlage shows for the next twelve months how hard each group is hit by your change initiatives. Sun means room for something new, storm means overload. The tool also suggests shifted start dates that avoid the storms.
What the tool shows
Every project is feasible on its own. All of them together are not.
ERP switch, CRM rollout, reorganisation and AI pilot are planned and approved one by one. The groups live through them at the same time. Wetterlage stacks all initiatives and shows where the total becomes too much.
You enter
- +Groups with size, base capacity and mood
- +How many changes a group has been through in the last twelve months
- +Initiatives with start, duration, type and impact per group
- +How far each initiative can be moved
You get
- →Weather map per group and month, from sunny to storm
- →Storm warnings with the initiatives that cause them
- →Smoothing: shifted start dates with a before-and-after comparison
- →One-page situation report for management
Method
How Wetterlage calculates.
Every figure can be traced. The tool gives the formula for every number; here are the most important ones.
Calculation
- +Load curve per initiative by type: process, system, organisation, culture
- +Load = sum of impact per group × load curve in the month
- +Capacity = base capacity × mood factor × fatigue factor
- +Saturation = load ÷ capacity; above 125% counts as a storm
Assumptions and limits
- →System rollouts peak at go-live and ease off afterwards
- →Many changes in the previous year reduce capacity by up to 40%
- →Running and fixed-date initiatives are never moved
- →Smoothing looks at 24 months, so moving does not just postpone the load
Example
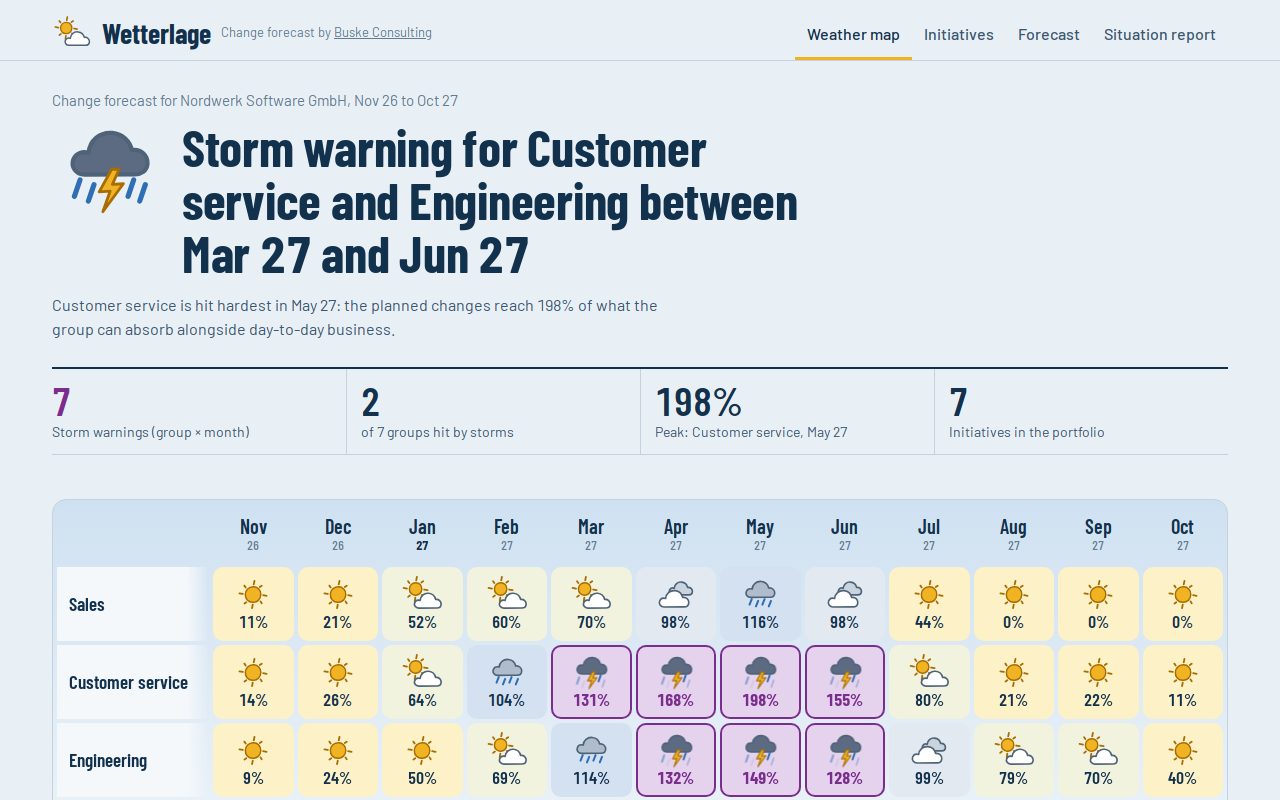
Example: storm warning for customer service and engineering.
At the fictitious Nordwerk Software GmbH, seven initiatives run across seven groups, from the ERP switch to the AI copilot in support. In May, planned change in customer service reaches 198% of what the group can absorb alongside day-to-day business. Wetterlage shows which start dates can be moved so the storms get smaller.
Frequently asked questions
Questions about Wetterlage.
What is change saturation?
The ratio between the change coming at a group and the change it can absorb alongside day-to-day business. Above 100% overload begins; above 125% Wetterlage issues a storm warning.
Where do the load curves come from?
From typical courses of change initiatives: system rollouts rise until go-live and ease off afterwards, culture change runs flatter and longer. The curves are disclosed in the tool.
Does the tool move my projects automatically?
No. Wetterlage suggests shifts within the leeway you set for each initiative and shows before and after. You decide whether to adopt them.
Who sees our planning?
Nobody but you. Wetterlage calculates entirely in your browser, with no server and no sign-up.
How do I recognise change fatigue?
By rising staff turnover, falling participation and new systems that are hardly used after go-live. Wetterlage takes this into account through mood and the number of changes in the previous year, both of which lower a group’s capacity.
How much change can a group absorb at once?
That depends on size, mood and prior load. Wetterlage therefore calculates its own capacity for each group and compares it month by month with planned change, instead of applying a flat limit.
Pace change so that it lands.
In a free 30-minute initial call we review your assumptions and discuss how the self-assessment becomes a reliable diagnosis.